Data science portfolio by Konstantin Parfenov
This portfolio is a compilation of my data science and machine learning projects in recent years.
Stand-alone projects.
Energy market counterparty bankruptcy prediction analytics system
A client for this project is Rosenergoatom JSC. The task is to predict bankruptcy for a counterparty on a Russian wholesales energy and capacity market.
Fundamental data extracting and transformation procedures are written in SAS Base/Macro language and scheduled daily. Scripts combine raw payment data, data from corporate sources, various scrapped data from .pdf and .html files and put them in an Oracle database. The connection between Oracle database and Atomcloud (“IBM Cloudpak for data” deployed on Data center Kalininsky) was approved by the internal Information Security Department.
Python script, which executes on a dedicated runtime described in the environment management tab, performs further data transformation, data cleaning, and data quality check.
Model compares 6 approches:
- Logistic Regression
- Knearest Neighbours
- Support Vector Classifier
- Decision Tree Classifier
- MLP Neural Network Classifier
- Gradient Boosting Classifier
Prediction results from both, Gradient Boosting Classifier and MLP Neural Network Classifier are represented in an analytical dashboard.
Core Project Features:
- Data quality and logging
- Scheduled daily model update
- SMOTE approach to imbalanced classification
- Web application for analytics with visualization
Team: Konstantin Parfenov, Vladislav Vedenev, Andrey Revyakin
Presentation and media files:
- RUS Rosenergoatom JSC presentation
- RUS Short video of product description for Rosatom CEO (Alexey Likhachev)
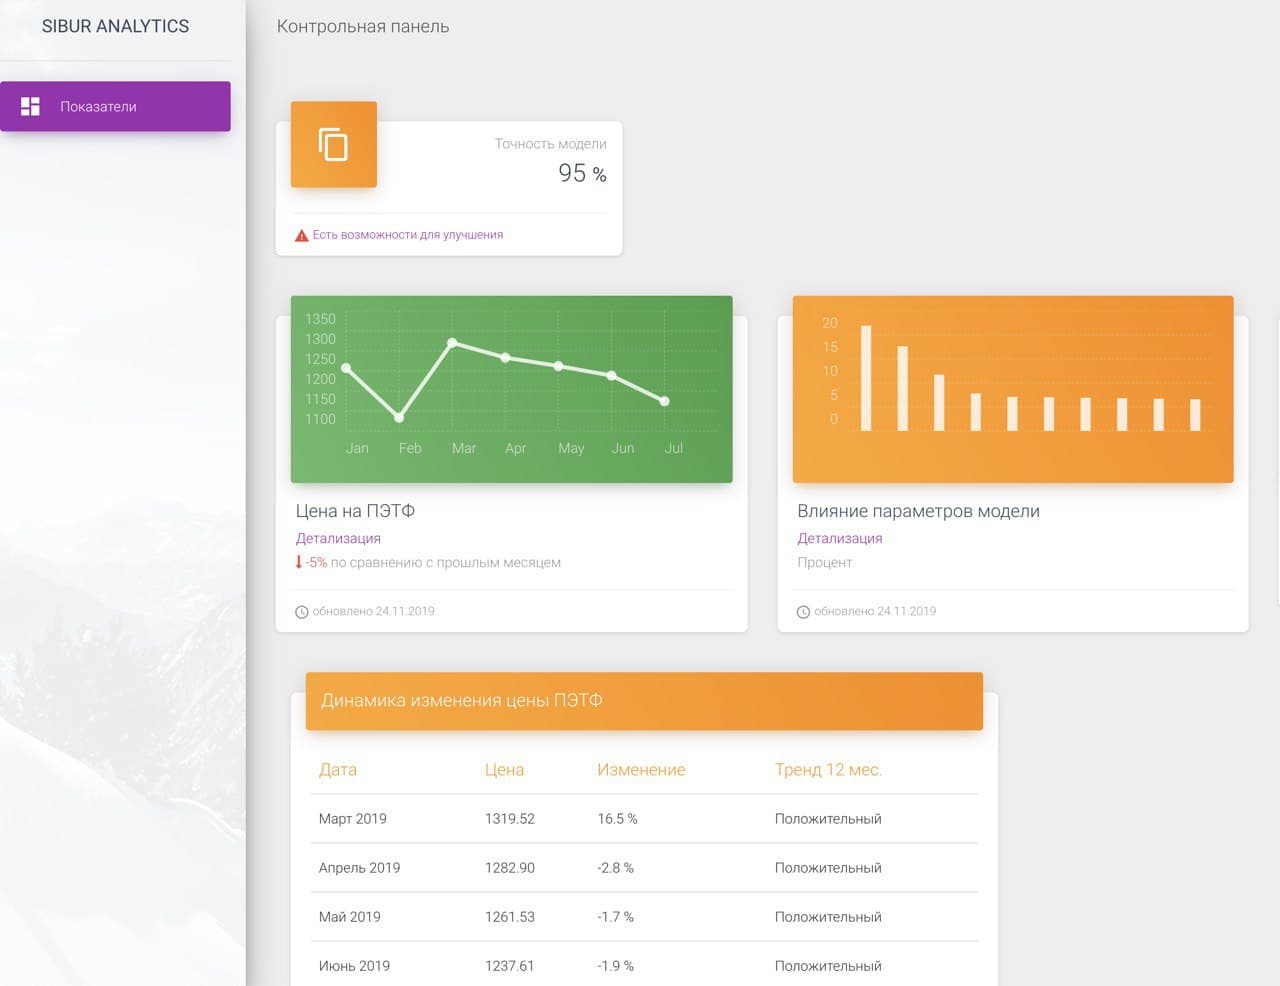
Sibur PET-price Prediction
PET price prediction dashboard for Sibur analytics. Created in 2019 at Sibur Hackathon. Github
Team: Konstantin Parfenov, Arthur Y. (telegram @art213)
Features:
- Predictions based on Exponential Moving Average (EMA) and Simple Moving Average (SMA)
- Feature importances graph
- Dashboard built using flask model view controller structure and javascript.
- Deploy on Heroku via Heroku_CLI.
- Frontend theme is a modified free template from Creative Tim
DMP-System user classification
Team:Konstantin Parfenov, Yuriy Kostyushko, Anatoliy Kurtov
The task of this project was to make a python script to classify the age group and sex group of a user based on his browser history. This script is intended to run in a cron job and the input is from Standard input (stdin)ю Besides the ROC-AUC treshold, this model has SLA for each prediction of 0.04 seconds.
I and my team made three approaches. The first approach was the Neural Network approach. The model was built with TensorFlow and has comparable results however, it was computational heavy to meet SLA limits. The second approach was with the XGBoost algorithm. The accuracy and speed of this model were enough to meet the task requirements. In the third approach we used “bag of words” algorithm unfortunately, the accuracy of this model was insufficient. Another notable decision was to scrap Yandex categories for the top 100 sites in each category and use this data during the training process of our model.
Big data Spark Projects
RecSys for videocontent Megafon
The task was to create the best RecSys algorithm based on RMSE metrics. Data on HDFS. Data sources:
- Film rating table
- User text tags for each film
- Movie description table
- Table with films id connected to IMDB database.
Model Used: Alternating Least Square (ALS) a matrix factorization algorithm.
Result RMSE<0.83
Content-based RecSys for e-learning courses
Team: Konstantin Parfenov, Yuriy Kostyushko,
The task was to create a content-based RecSys algorithm for the e-learning portal “eclass.cc”
Model Used:TF-IDF
Apache Hive user classifiaction for DMP system
The task was to classify internet users in groups based on their browser history and define domain relevance to a user group “motorist”.
I solved this task using Apache Hive. Files were in HDFS directory. Each file was a collection of logs represented as a tuple (UID, timestamp, URL). Algorithm for domain definition
Kaggle competitions.
OSIC Pulmonary Fibrosis Progression
Silver medal for lung function decline prediction.
Model: Optimized baseline Lasso Regression model
The aim of this competition is to predict a patient’s severity of decline in lung function based on a CT scan of their lungs. Lung function is assessed based on output from a spirometer, which measures the forced vital capacity (FVC), i.e. the volume of air exhaled.
In the dataset, you are provided with a baseline chest CT scan and associated clinical information for a set of patients. A patient has an image acquired at time Week = 0 and has numerous follow up visits over the course of approximately 1-2 years, at which time their FVC is measured.
In the training set, you are provided with an anonymized, baseline CT scan and the entire history of FVC measurements. In the test set, you are provided with a baseline CT scan and only the initial FVC measurement. You are asked to predict the final three FVC measurements for each patient, as well as a confidence value in your prediction.